

Plotting a good straight or curve linear graph with real time update is one of the most effective way of representing any frequently changing data on our web applications.
Take for instance we all love the way Google represent our reports graphically on Google Analytics, Google AdSense and Google webmaster Tools Report Dashboard.
Representing data Graphically is very useful in our various projects like plotting Voltage and Current against time.
 Download Script
 Live Demo
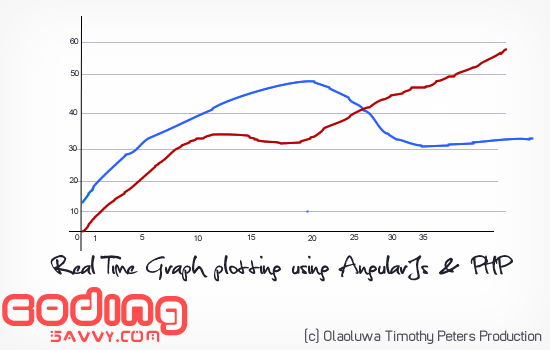
To plot our graph this we are going to use PHP as the sever side language : Our server.php file will get JSON data from the MySQL database and use it to plot a graph of Maximum power demand of a building against Time.
if(isset($_GET['phase'])){
$db = mysqli_connect("localhost","root","","meterdata");
$cat = mysqli_real_escape_string($db,$_GET['phase']);
$last =0; $vpg = 20;
if(isset($_GET['last'])){ $last = (empty($_GET['last']) ? 1:(int)mysqli_real_escape_string($db,$_GET['last']));}
if(isset($_GET['vpg'])){ $vpg = (empty($_GET['vpg']) ? 20 :(int)mysqli_real_escape_string($db,$_GET['vpg']));}
$query = "SELECT * FROM phase{$cat} ORDER BY `Timestamp` ASC limit {$last}, {$vpg} ";
$data = mysqli_query($db, $query);
$gdata = array();
while($row = mysqli_fetch_array($data)){
array_push($gdata , array('x'=>(int)$row['Timestamp'],'y'=>(int)$row['Max_demand'],'y2'=>(int)$row['Real_power'])); }
echo json_encode(array("phases"=> $gdata)); }
For the plotting of the graph data against each other we are going to use AngularJs to show our data and plot it against each other,
we will also use it to trigger the real time update function to make sure that our graph is plotted in time depending on the time variation supplied and the points per graph chosen.
$db = mysqli_connect("localhost","root","","meterdata");
$cat = mysqli_real_escape_string($db,$_GET['phase']);
$last =0; $vpg = 20;
if(isset($_GET['last'])){ $last = (empty($_GET['last']) ? 1:(int)mysqli_real_escape_string($db,$_GET['last']));}
if(isset($_GET['vpg'])){ $vpg = (empty($_GET['vpg']) ? 20 :(int)mysqli_real_escape_string($db,$_GET['vpg']));}
$query = "SELECT * FROM phase{$cat} ORDER BY `Timestamp` ASC limit {$last}, {$vpg} ";
$data = mysqli_query($db, $query);
$gdata = array();
while($row = mysqli_fetch_array($data)){
array_push($gdata , array('x'=>(int)$row['Timestamp'],'y'=>(int)$row['Max_demand'],'y2'=>(int)$row['Real_power'])); }
echo json_encode(array("phases"=> $gdata)); }
toba.factory('phaseRefreshService', function ($interval,$http) {
var _fetch = function (phase,last,resultCallback,loaded) {
$http.get("server.php?&phase="+phase.cat+"&last="+last+"&vpg="+phase.vpg)
.success(function(data, status, headers, config) {
loaded(true);
//rep.message = "Data Loaded successfully";
resultCallback(data.phases);
}) .error(function(data, status, headers, config) {
switch(status) {
case 401: { //rep.message = "You must be authenticated!"
break; }
case 500: { //rep.message = "Something went wrong!";
break; } }
loaded(false);
console.log(data, status);
}); } };
return { fetch: _fetch };
});
toba.controller('tobaCtrl', ['$scope','$interval','$http','phaseRefreshService', function($scope, $interval,$http,phaseRefreshService){
$scope.receivedPhases = 0;
$scope.getData = function (phase) { $interval(function(){ phaseRefreshService.fetch(phase,$scope.receivedPhases,function(result){
$scope.phaseData = result;
$scope.receivedPhases++;
},function(load){
$scope.phasesLoaded = load;
});
if($scope.phaseData.length>phase.vpg){
$scope.phaseData.splice(0,1);} },
(phase.auto*1000));
};
$scope.phaseData = [ { x: 0, y: 0, y2:0 } ];
$scope.options = { axes: { x: {key: 'x', ticksFormat: '.2f', type: 'linear', ticks: 2},
y: {type: 'linear',ticksFormat: '.2f', zoomable:true, ticks: 10, innerTicks: true, grid: true}}, margin: { left: 200 }, series: [ { y: "y", label: "Maximum Demand", color: "#d62728", drawDots: true, dotSize: 4 }, { y: "y2", label: "Real Power", color: "#A2D246", drawDots: true, dotSize: 4 } ],lineMode: 'cardinal', tooltip: { mode: "scrubber" } }; }]);
The final touch will be done by our index.html file var _fetch = function (phase,last,resultCallback,loaded) {
$http.get("server.php?&phase="+phase.cat+"&last="+last+"&vpg="+phase.vpg)
.success(function(data, status, headers, config) {
loaded(true);
//rep.message = "Data Loaded successfully";
resultCallback(data.phases);
}) .error(function(data, status, headers, config) {
switch(status) {
case 401: { //rep.message = "You must be authenticated!"
break; }
case 500: { //rep.message = "Something went wrong!";
break; } }
loaded(false);
console.log(data, status);
}); } };
return { fetch: _fetch };
});
toba.controller('tobaCtrl', ['$scope','$interval','$http','phaseRefreshService', function($scope, $interval,$http,phaseRefreshService){
$scope.receivedPhases = 0;
$scope.getData = function (phase) { $interval(function(){ phaseRefreshService.fetch(phase,$scope.receivedPhases,function(result){
$scope.phaseData = result;
$scope.receivedPhases++;
},function(load){
$scope.phasesLoaded = load;
});
if($scope.phaseData.length>phase.vpg){
$scope.phaseData.splice(0,1);} },
(phase.auto*1000));
};
$scope.phaseData = [ { x: 0, y: 0, y2:0 } ];
$scope.options = { axes: { x: {key: 'x', ticksFormat: '.2f', type: 'linear', ticks: 2},
y: {type: 'linear',ticksFormat: '.2f', zoomable:true, ticks: 10, innerTicks: true, grid: true}}, margin: { left: 200 }, series: [ { y: "y", label: "Maximum Demand", color: "#d62728", drawDots: true, dotSize: 4 }, { y: "y2", label: "Real Power", color: "#A2D246", drawDots: true, dotSize: 4 } ],lineMode: 'cardinal', tooltip: { mode: "scrubber" } }; }]);
<!DOCTYPE html>
<html ng-app="toba">
<head>
<meta charset="UTF-8">
<title>Real Time graph Plotting</title>
<script src="./lib/angularjs.js"></script>
<script src="./lib/d3.min.js"></script>
<script src="./lib/line-chart.min.js">
</script> <script> // Creating the module called user
var toba = angular.module("toba", ['n3-line-chart']);
</script>
<script src="./controller.js"></script>
<style> .selected { background-color: #FAFAD2; } .container { width: 600px; height: 300px; } </style> </head> <body ng-controller="tobaCtrl">
<div > <table cellpadding="2" cellsapcing="2" >
<form name="phaseForm"> <th>Phase: <form >
<select ng-model="phase.cat" >
<option value="1" ng-selected="selected">Phase 1</option> <option value="2">Phase 2</option> <option value="3">Phase 3</option> </select>
PPG: <select ng-model="phase.vpg" >
<option value="5" ng-selected="selected">5 Points</option>
<option value="10">10 Points</option>
<option value="20">20 Points</option>
</select> Update Interval(s) :<input type="number" placeholder="Auto Reload Time" ng-model="phase.auto" />
<button ng-disabled="phaseForm.$invalid || !phase.auto || !phase.cat" ng-click="getData(phase)" >Plot!</button> </form> </th></tr> </tr></form> </table>
</div> <div ng-hide="phaseData.length >0"> There are no Data in the Database. </div> <div style="float:left"> <table cellpadding="5" cellsapcing="5" >
<thead> <tr><th></th><th>
<a href="" ng-click="field = 'x'; order=order">Time(s)</a></th> <th><a href="" ng-click="field = 'y'; order=!order">MaxDemand(W)</a></th></tr> </thead>
<tbody ng-show="phasesLoaded"> <tr ng-class="{selected: phase.selected}" ng-repeat="phase in phaseData | filter:criteria | orderBy:field:order" > <td>
<input type="checkbox" ngmodel="phase.selected" value="{{phase.id}}" /></td>
<td><span ng-bind="phase.x"></span></td> <td><span ng-bind="phase.y"></span></td> </tr> </tbody> </table></div> <div >
<linechart data="phaseData" options="options" mode="" width="1090" height=""></linechart></div> </body> </html>
Thanks!
Your feedback helps us improve tutorials.
No comments:
Post a Comment